Measure of central tendency
Introduction..
- A measure of central tendency is a single value that attempts to describe a set of data by identifying the central position within that set of data. As such, measures of central tendency are sometimes called measures of central location. They are also classed as summary statistics. The mean (often called the average) is most likely the measure of central tendency that you are most familiar with, but there are others, such as the median and the mode.
The mean, median and mode are all valid measures of central tendency, but under different conditions, some measures of central tendency become more appropriate to use than others. In the following sections, we will look at the mean, mode and median, and learn how to calculate them and under what conditions they are most appropriate to be used.
There are 3 type in measure of central tendency:
1) Mean
2) Median
3) Mode
1. Mean (Arithmetic)
- The mean (or average) is the most popular and well known measure of central tendency. It can be used with both discrete and continuous data, although its use is most often with continuous data (see our types of variable guide for data types). The mean is equal to the sum of all the values in the data set divided by the number of values in the data set.
This formula is usually written in a slightly different manner using the Greek capitol letter,  , pronounced "sigma", which means "sum of...":

The mean is essentially a model of your data set. It is the value that is most common. You will notice, however, that the mean is not often one of the actual values that you have observed in your data set. However, one of its important properties is that it minimizes error in the prediction of any one value in your data set. That is, it is the value that produces the lowest amount of error from all other values in the data set.
An important property of the mean is that it includes every value in your data set as part of the calculation. In addition, the mean is the only measure of central tendency where the sum of the deviations of each value from the mean is always zero.
Knowing this, let us try an example:
Example 1:
3, -7, 5, 13, -2
The mean is essentially a model of your data set. It is the value that is most common. You will notice, however, that the mean is not often one of the actual values that you have observed in your data set. However, one of its important properties is that it minimizes error in the prediction of any one value in your data set. That is, it is the value that produces the lowest amount of error from all other values in the data set.
An important property of the mean is that it includes every value in your data set as part of the calculation. In addition, the mean is the only measure of central tendency where the sum of the deviations of each value from the mean is always zero.
The formula for calculating a mean is:
Mean = (X1 + X2 + X3 + ... +XN) / N
where X1, X2, X3,... XN are the values of the observations being averaged and N equals the number of observations
Negative Numbers
How do you handle negative numbers? Adding a negative number is the same as subtracting the number (without the negative). For example 3 + (−2) = 3−2 = 1.Knowing this, let us try an example:
Example 1:
3, -7, 5, 13, -2
- The sim of these number is 3 -7 + 5 + 13 - 2 =12
- There are 5 numbers
- The mean is equal to 12 ➗ 5 = 2.4
here is how to do it one line:
Example 2:
A random sample of 10 American college students reported sleeping 7, 6, 8, 4, 2, 7, 6, 7, 6, 5 hours, respectively. What is the sample mean?
Solution. The sample mean is:
x¯=7+6+8+4+2+7+6+7+6+510=5.8
Example 3:
Find the mean of 12, 12, 23, 10, 10, 15, 15, 15, 9, 17
Total all the number above then divided by the number given
Solution:
12 + 12 + 23 + 10 + 10 + 15 + 15+ 15 + 9 +17 / 10
= 138 / 10
= 13.8
2. Median
The median is the middle score for a set of data that has been arranged in order of magnitude. The median is less affected by outlines and skewed data. In order to calculate the median, suppose we have the data below:| 65 | 55 | 89 | 56 | 35 | 14 | 56 | 55 | 87 | 45 | 92 |
We first need to rearrange that data into order of magnitude (smallest first):
| 14 | 35 | 45 | 55 | 55 | 56 | 56 | 65 | 87 | 89 | 92 |
Our median mark is the middle mark - in this case, 56 (highlighted in bold). It is the middle mark because there are 5 scores before it and 5 scores after it. This works fine when you have an odd number of scores, but what happens when you have an even number of scores? What if you had only 10 scores? Well, you simply have to take the middle two scores and average the result. So, if we look at the example below:
| 65 | 55 | 89 | 56 | 35 | 14 | 56 | 55 | 87 | 45 |
We again rearrange that data into order of magnitude (smallest first):
| 14 | 35 | 45 | 55 | 55 | 56 | 56 | 65 | 87 | 89 |
Only now we have to take the 5th and 6th score in our data set and average them to get a median of 55.5.
One numbers in the middle
Example 1:
How to find the median value?
Solution: Put them in order:
3, 5, 12
The middle is 5, so the median is 5.
Example 2:
3, 13, 7, 5, 21, 23, 39, 23, 40, 23, 14, 12, 56, 23, 29
When we put those numbers in order we have:
3, 5, 7, 12, 13, 14, 21, 23, 23, 23, 23, 29, 39, 40, 56
Solution: There are fifteen numbers. Our middle is the eighth number:
Solution: There are fifteen numbers. Our middle is the eighth number:
3, 5, 7, 12,
13, 14, 21, 23, 23, 23, 23, 29,
39, 40, 56
The median value of this set of numbers is 23.
Example 3: Find the median in 2, 12, 23, 5, 25, 7, 8, 9, 10, 11, 12
Solution:*arrange the number from the smaller number to the biggest number.
2, 5, 7, 8, 9, 10, 11, 12, 12, 23, 25
* cancel one by one from in front and behind
The middle number is 10
Two Numbers in the Middle
BUT, with an even amount of numbers things are
slightly different.
In that case we find the middle
pair of numbers, and then find the value that is half
way between them. This is easily done by adding them together
and dividing by two.
Example 1:
3, 13,
7, 5, 21, 23, 23, 40, 23, 14, 12, 56, 23, 29
Solution: When we put those numbers in order we have:
3, 5, 7, 12, 13, 14, 21, 23, 23, 23, 23, 29, 40, 56
There are now fourteen numbers and so we don't have just one middle number, we have a pair of middle numbers:
3, 5, 7, 12, 13, 14, 21, 23, 23, 23, 23, 29, 40, 56
In this example the middle numbers are 21 and 23.
To find the value halfway between them, add them together and divide by 2:
21 + 23 = 44
then 44 ÷ 2 = 22
then 44 ÷ 2 = 22
So the Median in this example is 22.
Example 3:
(Note that 22 was not in the list of numbers ... but that is OK
because half the numbers in the list are less, and half the numbers are
greater.)
Example 2:
There are 66 numbers
66 plus 1 is 67, then divide by 2 and we get 33.5
33 and a half? That means that the 33rd and 34th numbers in the sorted list are the two middle numbers.
So to find the median: add the 33rd and 34th numbers together and
divide by 2.The answer is 33.5
Example 3:
| A marathon race was completed by 4 participants. What was the median race time? | ||
| 2.7 hr, 8.3 hr, 3.5 hr, 5.1 hr | ||
| Solution: | Ordering the data from least to greatest, we get: | |
| 2.7, 3.5, 5.1, 8.3 | ||
| Since there is an even number of items in the data set, we compute the median by taking the mean of the two middlemost numbers. | ||
| 3.5 + 5.1 = 8.6 ➗ 2 The answer is the median race time was 4.3 hr. |
||
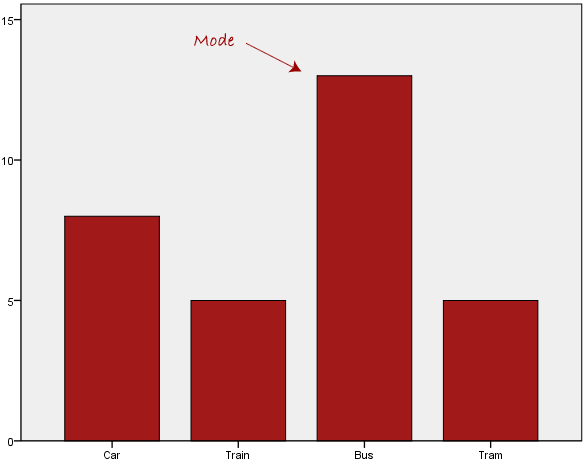
3. Mode
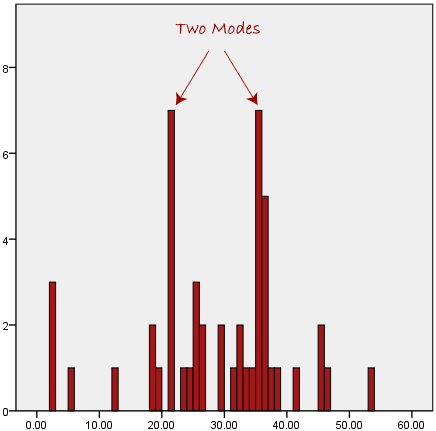
The mode is the most frequent score in our data set. On a histogram it represents the highest bar in a bar chart or histogram. You can, therefore, sometimes consider the mode as being the most popular option. An example of a mode is presented below: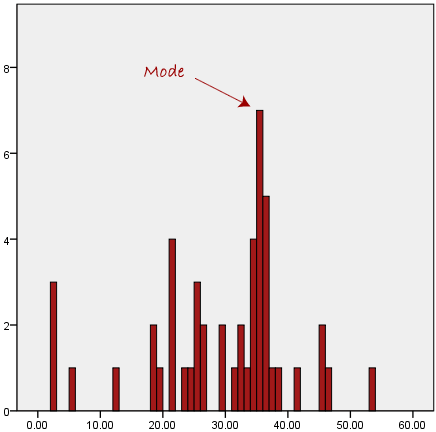
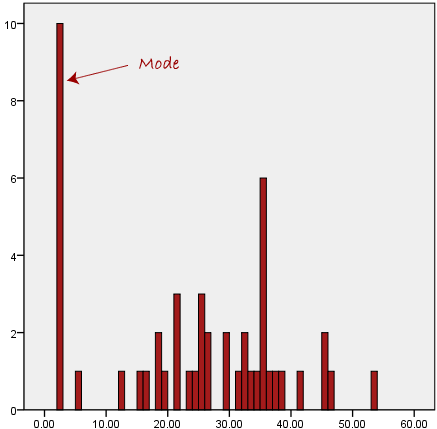
Another problem with the mode is that it will not provide us with a very good measure of central tendency when the most common mark is far away from the rest of the data in the data set, as depicted in the diagram below:
Example 1:
To find the mode, or modal value, first put the numbers in order, then count how many of each number. A number that appears most often is the mode.
3, 7, 5, 13, 20, 23, 39, 23, 40, 23, 14, 12, 56, 23, 29
In order these numbers are:
3, 5, 7, 12, 13, 14, 20, 23, 23, 23, 23, 29, 39, 40, 56
This makes it easy to see which numbers appear most often.
In this case the mode is 23.
Example 2:
{19, 8, 29, 35, 19, 28, 15}
Arrange them in order: {8, 15, 19, 19, 28, 29, 35}
19 appears twice, all the rest appear only once, so 19 is the mode.
Example 3:
{45, 33, 3, 8, 5, 6, 7, 17, 3, 3, 43}
Arrange them in order: {3, 3, 3, 5, 6, 7, 8, 17, 33, 43, 45}
3 is the most number among all the number here, so the mode is 3
This video is show you what is the different of mean, median and mode and it will show you how to solve it. 😃
Exercise
... Try your best ...
1) What is the mean of the numbers 8, 9, 13 and 18?
2) What is the median of the numbers 4, 2, 11, 6, 2?
3) What is the mode for the numbers 7, 6, 5, 8, 7, 5, 9, 3, 5, 4?